We all know that a page that loads in three seconds will provide a negative user experience. But does having every page load in less than one second make a meaningful difference? How can you tell? When is enough … enough? Non-functional requirements such as performance are often not precise enough to be specified as discrete numbers. Rather, they work on a sliding scale of acceptability.
Would slightly better performance be significantly more valuable from a market perspective? Would significantly better performance be just slightly more expensive to implement? When dealing with performance, usability, reliability and so forth, we often end up in a difficult trade-off analysis.
— An Industrial Evaluation of the QUPER Model, Svensson et al.
The QUality PERformance (QUPER) Model attempts to visualize the trade-off between cost, value, and quality by emphasizing the non-linear relationship between these traits. The model assumes that such non-functional requirements produce benefits that follow an S curve as plotted in the following figure.
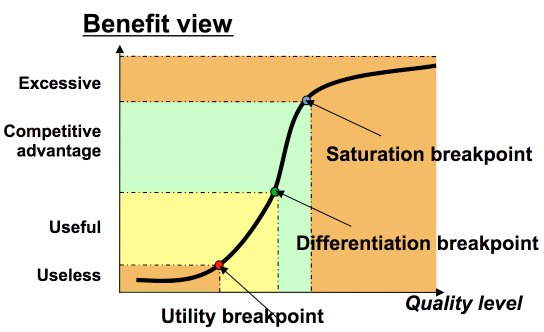
The curve has three notable breakpoints where the rate of change of the curve increases or decreases: utility, differentiation, and saturation. Utility is the point where a feature moves from unusable to usable, differentiation is the point where the feature becomes a competitive advantage, and saturation is where the increase in quality is no longer justified. If we move beyond the saturation point, we are starting to invest resources in the wrong area.
As an intuitive example, consider a desktop application that is measuring startup time. If the app takes five minutes to load, it basically becomes unusable. To be usable, or to reach the utility point, startup time should be under one minute. After we’ve reached utility, we can measure the competition and notice that if our app takes under 500 milliseconds to load then we have a competitive advantage — we’ve reached a differentiation point. We can keep optimizing for startup time but at some point, say 100 milliseconds, we will reach saturation and further focus on startup time is just not worth it.
We can also plot the cost of development against the quality of the feature to derive a cost view, with inflection points on the curve called barriers.
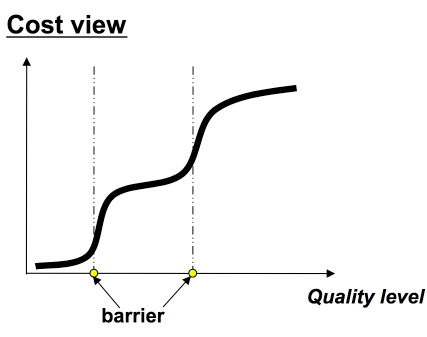
As Gojko Adzic puts it in Specification by Example:
At some point, cost becomes steep.
Using the QUPER model, we explicitly identify the breakpoints in the benefit curve and view those breakpoints alongside the cost barriers associated with that feature. By doing so, we can have a more meaningful discussion about the actual product we are trying to build.
Defining barriers and breakpoints for sliding scale requirements allows us to have a more meaningful discussion on where the product fits in the market and where we want it to be.
– Specification by Example, Gojko Adzic