Application Portfolio Management (APM) draws inspiration from financial portfolio management, which has been around since at least the 1970s. By looking at all applications and services in the organization and analyzing their costs and benefits, you can determine the most effective way to manage them as part of a larger overall strategy. This allows the architect or engineering leader to take a more strategic approach to managing their application portfolio backed by data. Portfolio management is crucial for creating a holistic view of your team’s technology landscape and making sure that it aligns with business goals.
You may wonder if your services align with current and prospective business goals, whether you allocate sufficient funds toward strategic areas, and whether there are nonessential applications consuming excessive resources. This evaluation might inspire plans to merge redundant applications or replace them altogether, thus optimizing costs and mitigating risk factors. An intentional analysis of all the applications or services in your company can help you address these crucial questions about your architecture and strategy, particularly when it comes time to investing additional time and money in a product or service. By identifying areas requiring attention, you can make targeted improvements.
A complete portfolio management exercise will help you:
- Identify and eliminate redundant and unused services.
- Consolidate similar services into a single service.
- Retire older and more expensive-to-maintain services.
Classifying Services by Risk versus Reward
At a high-level, a financial portfolio management exercise classifies any investment by risk versus reward. Applying this to software, we update the classification to measure risk as technology health or alignment to strategy, and to measure reward as business value. Then, we can create a simple graph that plots services along these two axes, with labels for the four quadrants in the graph:
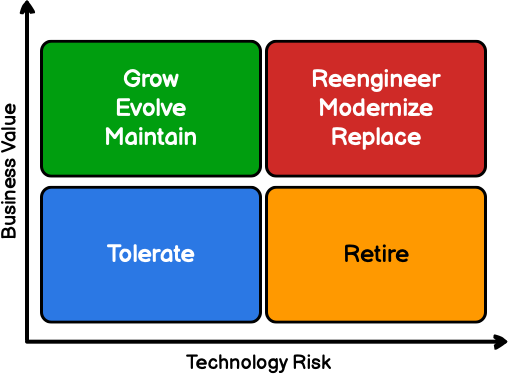
Any service or application in your organization with high business value, but low technology risk is something you want to continue to invest in which is represented in the graph by the “Grow/Evolve/Maintain” box. Conversely, a service or application that has low business value, but high technology risk is something you will want to remove from your environment, represented by the “Retire” box.
Each quadrant suggests a different posture or direction for each application or service:
Grow/Evolve/Maintain
Services in this quadrant are both crucial to your business strategy and pose minimal risk. You will want to make sure that you are appropriately investing in them so that they continue to grow and evolve alongside the needs of the business. Technology health is high, and you want to maintain that health because of the value to the business. Make sure they are supported with enough engineering effort with strong leadership.
Tolerate
Services in this quadrant are both low-value and low-risk. There is a purpose to them existing, but they don’t represent the future of the business or significant revenue. You need to invest enough in these services to “keep the lights on”. Try to minimize costs or staff them with engineers who enjoy optimizing for costs or performance rather than engineers who strive for innovation.
If possible, nudge services in this quadrant towards consolidation with services that are growing, or see if you can retire them and remove them from your environment completely.
Reengineer/Modernize/Replace
Services in this quadrant are the question marks that need to be resolved. They have high business value, but they have been technically mismanaged and represent considerable technical debt. These services do what they’re supposed to. But maybe they won’t scale in the current architecture to grow the business. Or maybe they’re out of headroom. Or maybe hasty they are running on an incredibly expensive and proprietary database platform. They need serious attention.
For services in this quadrant, you need to do further analysis on the best way to move them towards the Grow/Evolve/Maintain quadrant.
Retire
Services in this quadrant have low business alignment with high technical debt or technical risk. The costs to keep them around may far outweigh their value to the business, and the best thing to do is to retire them.
If you are an engineering manager, services in this quadrant may require tough people management decisions. You may need to move engineers to different projects, and explain why their project is being cancelled.
Scoring Services
Assigning services to the correct quadrants is the heart of the portfolio management exercise. This process involves a bit of upfront work to define the business and technology goals. If you don’t have agreement on what those are, this will likely be the most difficult part of this exercise. You will also need a list of the different services or applications in your organization and the proper owners of each of them.
Once you have the application list in place, establish a set of questions that you can ask about each application in order to establish its posture with respect to technology risk and business alignment. These questions should have a numeric score attached to them. Optionally add a weight for the relative importance of that score.
For example, this is the technology health scorecard I used on a recent portfolio management exercise:
| Technology Health (5 = Strongly Agree, 1= Strongly Disagree) |
|---|
| Application code adheres to standards/strategy |
| Application Infrastructure adheres to standards/strategy |
| Data adheres to information management architecture |
| Application architecture is modular |
| Application has appropriate fault-tolerance architecture |
| Application has appropriate scale plans |
| Monitoring/management is complete |
| Automated testing is complete |
| Training and documentation are complete |
| Security implementation is complete |
| Technology foundation will be relevant in three years |
| Application development requires a generic skill set |
| Core application is stable and meets SLAs |
| Integrations are stable and meet SLAs |
And this is the business value scorecard used during the same exercise:
| Business Criticality (5 = Strongly Agree, 1 = Strongly Disagree) |
|---|
| Application is a strategic differentiator |
| Application strategy is well-defined, consistent |
| Application is mission-critical |
| Application outage creates high customer impact |
| Application outage creates high corporate impact |
| Application features align with current platform/business needs |
| Application features align with future platform/business needs |
These scorecards should be tailored to your own environment and situation, but in general you will want to focus on how well an application aligns to your business strategy, how well it aligns to your technology standards or strategy, and its relative level of technology health.
Once you have the scores for each service, you can plot them on your 2x2 matrix with the quadrant labels. For example, the following graph shows a fictional set of services plotted onto the 2x2 matrix using the score from the service scorecard. The results show that we should retire the “Pipelines” service, and invest in “Cloud Runner” to bring it up to modern technology standards.
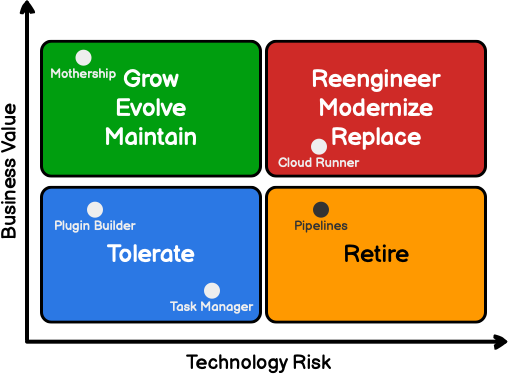
This final chart is the heart of your portfolio management work. It gives you a current state assessment, providing an easy visualization and reference into the overall strategy. With this knowledge in hand, we can make informed decisions on which initiatives we should continue, modify, stop or add based upon impact and urgency, taking care of short-term results while ensuring alignment with long term goals.
Ultimately, the chart serves as the foundation of executive engagement, making it a vital component of your strategic planning efforts moving forward. It is then up to you to bring those findings before other stakeholders and use it as the start of some crucial conversations and decisions.