Complex systems exhibit unexpected behavior.
— John Gall, The Systems Bible
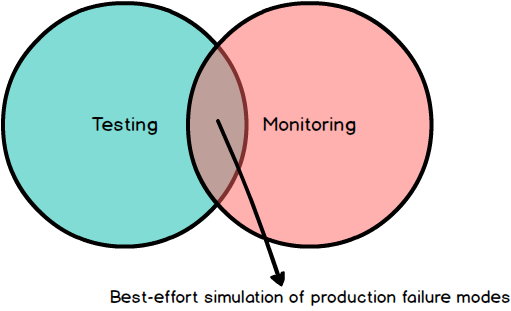
One reaction to the myriad failure cases we encounter with distributed systems is to add more testing. Unfortunately, testing is a best-effort verification of system correctness — we simply cannot predict the failure cases that will happen in production. What’s more, any environment that we use to verify system behaviour is — at best — a pale imitation of our production environment. An alternative to adding more tests is to add more monitoring and alerting so we know as soon as possible that a system shows signs of degradation. Unfortunately, monitoring and alerting suffers from the same faults as testing — we monitor for behaviour that is predictable in nature or that we have experienced in the past. Together, monitoring and testing try to enumerate all possible permutations of partial and total system failure. Unfortunately, they only provide a simulation of how you expect a system to actually function in production.
Given the shortcomings of monitoring and testing, we should shift focus to building observable systems. This means treating observability of system behaviour as a primary feature of the system being built, and integrating this feature into how we design, build, test, and maintain our systems. This also means acknowledging that the ease with which we can debug our production environment will be a key indicator of system reliability, scalability, and ultimately customer experience. Designing a system to be observable requires effort from three disciplines of software development: development, testing, and operations. None of these disciplines is more important than the others, and the sum of them is greater than the value of the individual parts. Let’s take some time to look at each discipline in more detail, with a focus on observability.
Developing for Observability
To develop for observability means to code with the acknowledgement that systems fail. These failures may be partial or full and they may affect your system, your dependencies, or your dependencies’ dependencies (yes, it’s turtles all the way down). In practise, this means implementing software by taking into account the runtime conditions that it will be subject to, the operational characteristics of your dependencies, and the ability to debug production issues.
Knowing how you intend to run your application in production is a requirement for being able to correctly support and debug it. This requires knowing the operational semantics of your application like how it handles restarts, how it discovers upstream dependencies, and how your application uses service discovery to join a cluster. Any and all of these things will fail at some point, and knowing how to trouble-shoot these issues will lead to a minimum amount of downtime.
Since our systems are built on top of dependencies, we also need to become familiar with our dependencies’ failure characteristics — including full and partial failures. This includes understanding how the load-balancing in front of your application forwards traffic to your service, the caching guarantees provided by your RPC client, the threading model used by your HTTP server, or the connection pooling characteristics of your database driver. Each of these dependencies may trigger deadlocks or starvation in your system, or trigger production alerts due to long-running requests or increased latency. Understanding possible failure modes allows you to design reliability around them.
Lastly, we need to write code that is debuggable. This involves being able to ask questions about your code at some point in the future by using the correct quantity and quality of logs and metrics, and making them available in a manner useful for operations.
Testing in Production
Testing is a best-effort verification of correctness. Until we run our services in production, we know nothing — it’s simply impossible to predict every service failure and write a test case for it. This isn’t to suggest that testing is worthless. On the contrary, testing is an essential part of software development that helps us write better, more maintainable code, and helps us avoid regressions and catastrophic error cases. However, it’s becoming more and more clear that relying on pre-production testing is largely ineffective in discovering all known failure cases of a system — certain types of failures can only be surfaced in a production environment which requires the ability to test in production.
The difference between production and any staging environments can have significant effects on service stability. These seemingly minor differences can include the cluster-size of a staging versus production environment, the number of concurrent users in staging versus production, or a size difference between a staging and production dataset. These differences make production a unique system, and it pays dividends to study and test how our software reacts in this unique environment in a controlled and measured way.
To help understand the different sets of tools and practises available for testing in production, we can divide the act of testing systems into several stages that include pre-production, deployment, release, and post-release.
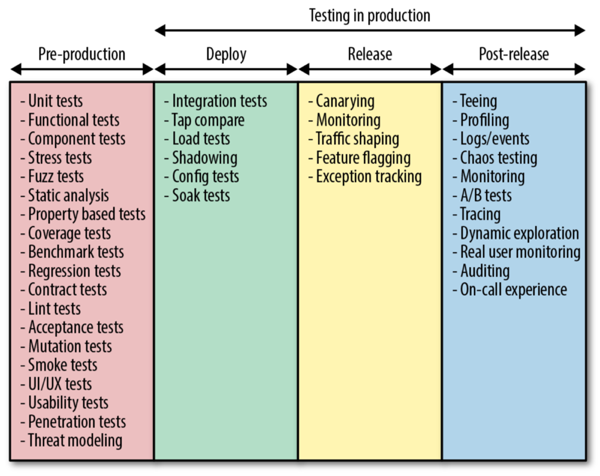
This separation of a release into phases means that deploying a service is a distinct activity from configuring that service to receive production traffic. This allows us to safely deploy new services without affecting customers. A fundamental tool to enable this type of release is some form of traffic shaping that allows you to gradually route production traffic to the newly released version of a service and observe the effect.
Rather than re-hash existing material, I will refer to this comprehensive blog post by Cindy Sridharan.
Operating with Observability
Operating our service in production requires access to the correct quantity and quality of logs, metrics, and traces. These are three powerful tools that, if used well, can allow us to better understand running systems. Although at first glance, these seem like simple tools, in reality it takes some time and experience to know how to use them well. Let’s look at each of them in turn.
Logs
Logs are immutable, timestamped records of events that happened in your system. Event logs shine when you need to debug rare or infrequent events in your system at a very fine level of granularity. When writing log messages, keep in mind that a complex system rarely fails because of one specific event in one specific component in a system. More often, a complex series of events in multiple systems is the reason for downtime. This, combined with the volume of logs generated from production traffic, means that it is rarely useful to log copious amounts of information as a means of understanding production behaviour. Instead, focus on rare or infrequent events that could be the cause of difficult to diagnose behaviour.
Metrics
Metrics provide a powerful way to measure the behaviour of critical components in your production environment. The numerical and time-sensitive nature of metrics means that their primary advantage over logs is that the transfer and storage of metrics has effectively no overhead. Because there is little overhead to storing metrics, it may be tempted to “measure all the things” but this risks missing the forest for the trees. It’s better to take the time to carefully consider the service-level guarantees you wish to provide to your customers and tailor your metric collection accordingly. A good starting point is the RED method: request rate, error rate, and duration of requests. Google’s Site Reliability Engineering book also has some great recommendations for developing meaningful metrics.
The biggest drawback to both logs and metrics is that they are scoped to a single system, which makes it difficult to understand global trends in your environment.
Tracing
Tracing provides a representation of a series of causally related events throughout an entire system. Traces provide visibility into the path that an entire request travels and the structure of such a request. The advantage of tracing is that it provides context to your system by allowing you to view all of the different interaction points between your service and its dependencies. The disadvantage is that each system in a path typically requires implementation work — and you still may have gaps when interacting with systems outside of your ecosystem.
Together, logs, metrics, and tracing are the three pillars of observability for operations. To make effective use of these resources, take time to consider how you will use them to aid production monitoring and support.
Summary
This article covered the broad topic of observability by focusing on three disciplines of software engineering: development, testing, and operations. By thinking carefully about how we can make our systems more observable in all three disciplines allows us to debug and diagnose production issues quickly, learn how our services operate in production, and ultimately create a better customer experience for our users due to decreased down-time and increased release velocity. Observability not only makes for a great end-user experience, it makes for a sustainable development and operations experience. This is only possible if development, testing, and operations work together to treat observability as a first-class feature in each system we support.
Focus on observability — your future self will thank you.