Complex processes may require collaboration and coordination of many components. We can model such processes using a Design Structure Matrix to represent information flow among the components, and then optimize the process to avoid rework and downtime.
As a simplified example, consider a project with only two tasks: “A” and “B”, and a directed graph representing this system where a vertex represents a task and an edge represents the flow of information between tasks. Depending on the process being modeled, these two vertices can be arranged in one of three different configurations.
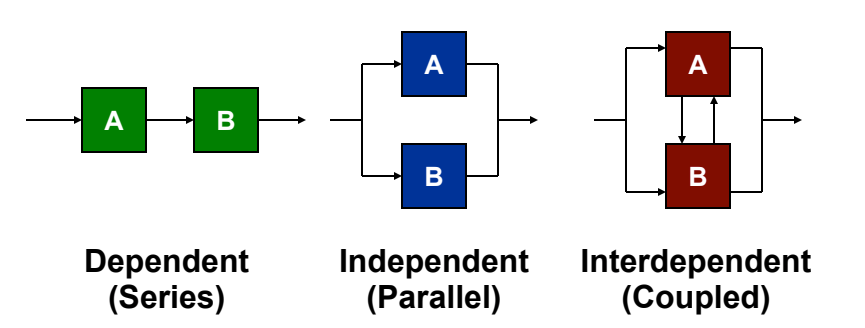
Parallel tasks do not interact with each other and can be executed at the same time. Sequential tasks are done in a linear fashion where the first task influences the behaviour or decision of a second task. Interdependent, or coupled, tasks are intertwined: A influences B and B influences A so any changes in information by either task result in rework.
We can take any directed graph and represent it as a matrix where marks in each row represent the inputs needed to complete the task named by that row and marks in a column reveal which tasks receive information from the task corresponding to that column. Using our simple two task example, we can represent the three different configurations as a matrix. The parallel configuration transfers no information between tasks and so has no marks. The dependent configuration has a single mark signalling the linear relationship between the two tasks. The interdependent configuration has marks on both sides of the tasks, showing the interdependent nature of the tasks.
| Independent (Parallel) | Dependent (Series) | Interdependent (Coupled) | |||
|---|---|---|---|---|---|
| A | B | A | B | A | B |
| A | A | A | X | ||
| B | X | B | X | B | |
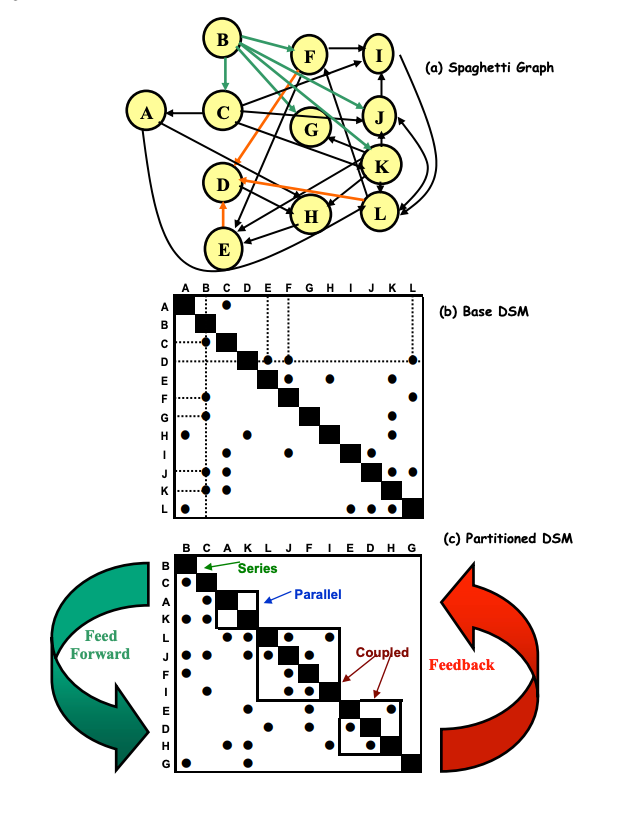
If we order the rows in the matrix to depict a time sequence, then marks below the diagonal line represent information that is transferred forward to later, dependent, tasks, and marks above the diagonal represent cyclical loops where information may be transferred backwards to earlier tasks. In many processes, the cyclic dependencies identify the potential for rework or coordination bottlenecks.
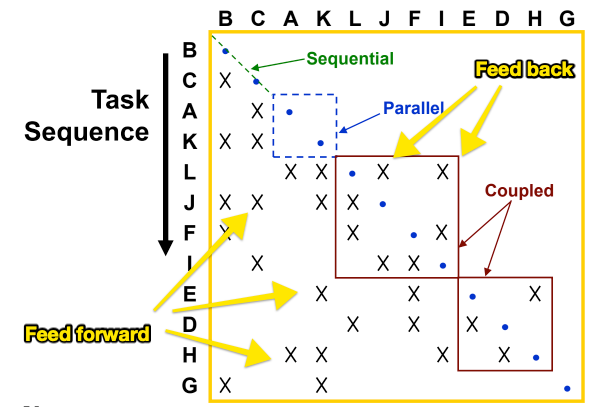
To minimize the number and size of these feedback loops, we can use a DSM process called sequencing, which re-orders the rows of the matrix to minimize cycles and their size. The first heuristic for obtaining a good task sequence is to find an ordering that minimizes feedback loops. A secondary heuristic is to “fail fast” by minimizing the distance between feedback loops where they can’t be avoided.
There are several iterative algorithms for sequencing a DSM available at DSM Web. The simplest algorithm to show the concept of process optimization is Steward’s path searching algorithm, outlined as follows:
- Activities with empty rows have no inputs and can be done first, order these at the top of the DSM.
- Activities with empty columns have no outputs and therefore provide no information to any downstream activities, these activities can be done last and should be placed at the end of the DSM.
- Find any cycles in the remaining elements through depth-first search.
- Group together all activities in a cycle as a single activity, and treat the group as its own step in the sequence.
After this algorithm converges to a steady state, the resulting process will have the fewest number of feedback loops and the steps in the process will be “close together”, meaning that each step does not have to spend a long time waiting for inputs from previous steps, thereby minimizing remaining feedback loops.
The following example, from An Introduction to Modeling and Analyzing Complex Product Development Processes Using the Design Structure Matrix (DSM) Method shows how a complex process represented by a graph can be optimized using a DSM approach to identify the steps that can be done in series, parallel, or with close coordination (coupled).