This article provides guide to the different developer tools available for writing eBPF programs, covering the core tools BCC, bpftrace, ebpf-go, and libbpf.
These tools satisfy a different use case depending on whether you are trying to use eBPF for running analysis scripts, or full-fledged programs, in what programming language you wish to use, and the maturity and feature parity with the most recent eBPF features in the Linux kernel.
Unfortunately, there is no single definitive guide to BPF and there is still a lot of unwritten knowledge, though some of the resources provided in this article may help you get started on your own journey.
BCC
There are several development toolchains that ease development of eBPF programs. In this section, we will look at bcc. Note that BCC is generally considered deprecated. However, the Python tools still provide the easiest way to get started with eBPF and provide a good overview of how eBPF tools work to combine userspace programs with kernel level observability.
bcc is a Python library that facilitates loading eBPF programs and collecting statistics on execution. The following diagram, from ebpf.io shows the execution of bcc programs.
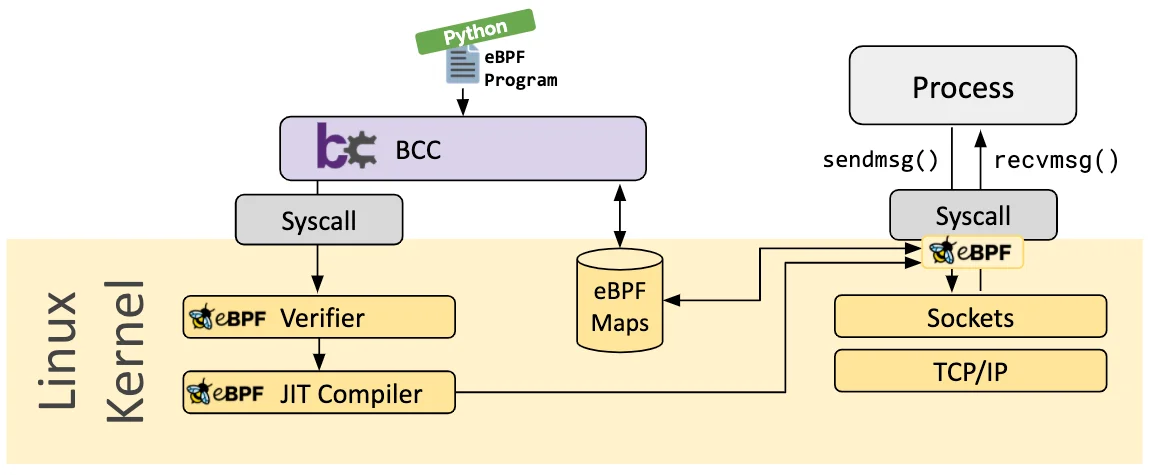
On the left side of the diagram, an ePBF program is loaded into the kernel by bcc, where it is verified and compiled. On the right side, a process is running, and the eBPF program populates a map data that is shared between the eBPF program and the userspace Python code. Back on the left side of the diagram, our Python program reads the same map structure to collect any data relevant for display.
The bcc framework is primarily targeted for application and system profiling, where a eBPF program is used to collect statistics into an eBPF map, and a Python application aggregates the data and displays it.
Installing BCC
Instructions for installing BCC are avaiable on Github. For my test machine, which is Amazon Linux 2, installation is as simple as
> sudo amazon-linux-extras install BCC
The installed binary includes bindings for Python 3. This assumes that
Python 3 is available /usr/bin/python. If your Python 3 version is in
a different location, you can
The binary packages include bindings for Python 3 only. The Python-based
tools assume that a python binary is available at /usr/bin/python, but
that may not be true on recent versions of Alpine. If you encounter
errors like <tool-name>: not found, you can try creating a symlink to
the Python 3 binary like, or creating an alias from python to python3:
> sudo ln -s $(which python3) /usr/bin/python
BCC Tools
BCC includes some tools that are already written that you can use to
diagnose issues. On a default installation of BCC you can find these
tools at /usr/share/bcc/tools, where you can find hundreds of existing
tools.
Let’s take a look at one tool, execsnoop. execsnoop prints one line of
output for each new process created. It works by tracing exec() system
calls. You can use this to check for short-lived processes. These can
consume CPU resources, and may indicate a crash-loop, but this data may
not show up in most monitoring tools that periodically take snapshots of
which processes are running since the processes are short-lived. On my
machine, this is the output I receive:
/usr/share/bcc/tools $ sudo ./execsnoop
PCOMM            PID    PPID   RET ARGS
date             13358  13357    0 /usr/bin/date +%s
pidof            13361  13360    0 /sbin/pidof java
sleep            13362  3147     0 /usr/bin/sleep 1
date             13364  13363    0 /usr/bin/date +%s
pidof            13367  13366    0 /sbin/pidof java
sleep            13368  3147     0 /usr/bin/sleep 1
date             13370  13369    0 /usr/bin/date +%s
pidof            13373  13372    0 /sbin/pidof java
sleep            13374  3147     0 /usr/bin/sleep 1
execsnoop is a Python program written with BCC, you can go ahead and edit the execsnoop file to see what it looks like:
> vim execsnoop
The file is roughly 300 lines of code, with 100 or so being argument
parsing, and another 50 or so formatting output. The more relevant
section for understanding how BCC works is where the BPF program is
defined.
The code block sets a variable bpf_text to a string which represents
BPF program written in C.
# define BPF program
bpf_text = """
#include <uapi/linux/ptrace.h>
#include <linux/sched.h>
#include <linux/fs.h>

#define ARGSIZE  128

enum event_type {
    EVENT_ARG,
    EVENT_RET,
};

struct data_t {
    u32 pid;  // PID as in the userspace term (i.e. task->tgid in kernel)
    u32 ppid; // Parent PID as in the userspace term (i.e task->real_parent->tgid in kernel)
    u32 uid;
    char comm[TASK_COMM_LEN];
    enum event_type type;
    char argv[ARGSIZE];
    int retval;
};

BPF_PERF_OUTPUT(events);

...
Further down the eBPF program is loaded into the kernel using the eBPF Python library and attached to the execve system call. Whenever this system call is executed, the eBPF program is run.
# initialize BPF
b = BPF(text=bpf_text)
execve_fnname = b.get_syscall_fnname("execve")
b.attach_kprobe(event=execve_fnname, fn_name="syscall__execve")
b.attach_kretprobe(event=execve_fnname, fn_name="do_ret_sys_execve")
The existing tools provided by BCC provide examples of using BPF programs written in C to analyze a system. You can use these tools as is, or view the source code to understand how they are written and how they can be used
Writing your own eBPF programs using BCC
The simplest eBPF program you can develop using BCC is a simple “Hello, World!” script:
#!/usr/bin/python
from bcc import BPF

program = """
int hello(void *ctx) {
    bpf_trace_printk("Hello World!");
    return 0;
}
"""

b = BPF(text=program)

syscall = b.get_syscall_fnname("execve")
b.attach_kprobe(event=syscall, fn_name="hello")
b.trace_print()
This code begins with a BFP program assigned to the program variable.
This program uses the bpf_trace_printk helper function to print a line of text
and then returns.
Next, the program is loaded into the kernel using the BPF(text=program)
Python call. This step runs the verifier and loads the BPF program.
Once loaded, we attach a hook to the execve system call that calls our
BPF program.
b.trace_print() continually reads the globally shared
/sys/kernel/debug/tracing/trace_pipe file and prints its contents. This
file is written to via eBPF using the bpf_trace_printk() function.
You can execute this as a regular Python program. BCC will load the
program into the kernel and the Python code trace_print() will
continuously read the output written by your eBPF code. Execution may
require sudo depending on your installation:
> sudo python hello.py
b' vfs-worker {"pi-30989 [001] d...  3437.197255: 0x00000001: Hello World!              sh-30990 [000] d...  3437.199016: 0x00000001: Hello World!              sh-30991 [007] d...  3437.199110: 0x00000001: Hello World! vfs-worker {"pi-30992 [002] d...  3437.208177: 0x00000001: Hello World! vfs-worker {"pi-30992 [002] d...  3437.208189: 0x00000001: Hello World! vfs-worker {"pi-30992 [002] d...  3437.208193: 0x00000001: Hello World! vfs-worker {"pi-30992 [002] d...  3437.208198: 0x00000001: Hello World! vfs-worker {"pi-30992 [002] d...  3437.208201: 0x00000001: Hello World! vfs-worker {"pi-30992 [002] d...  3437.208203: 0x00000001: Hello World! vfs-worker {"pi-30992 [002] d...  3437.208206: 0x00000001: Hello World! vfs-worker {"pi-30992 [002] d...  3437.208208: 0x00000001: Hello World! vfs-worker {"pi-30992 [002] d...  3437.208211: 0x00000001: Hello World! log4j-cve-2021--30994 [002] d...  3437.233674: 0x00000001: Hello World! log4j-cve-2021--30997 [003] d...  3437.235133: 0x00000001: Hello World! log4j-cve-2021-'
b'-30998 [003] d...  3437.239419: 0x00000001: Hello World! log4j-cve-2021--31000 [007] d...  3438.240560: 0x00000001: Hello World! log4j-cve-2021--31003 [000] d...  3438.242090: 0x00000001: Hello World! log4j-cve-2021--31004 [005] d...  3438.246294: 0x00000001: Hello World! vfs-worker {"pi-31005 [006] d...  3438.370317: 0x00000001: Hello World!              sh-31006 [000] d...  3438.371927: 0x00000001: Hello World! log4j-cve-2021--31008 [002] d...  3439.247429: 0x00000001: Hello World! log4j-cve-2021--31011 [004] d...  3439.248962: 0x00000001: Hello World! log4j-cve-2021--31012 [006] d...  3439.253211: 0x00000001: Hello World! log4j-cve-2021--31014 [0
BCC Reference Material
By examining the existing tools available in the BCC source code, you can get a sense of how eBPF programs are written and integrated with Python code. To dive deeper, there are two main resources you can leverage:
- bcc Python Developer Tutorial
- This tutorial develops a progressively deeper understanding of how to use BCC to write eBPF programs. Over 15 lessons
- bcc Reference Guide
- This reference guide provides documentation for all the bcc
function calls. Use this to understand how things like
trace_printare implemented and how you can use them in your program.
- This reference guide provides documentation for all the bcc
function calls. Use this to understand how things like
bpftrace
bpftrace is a high-level tracing language inspired by awk, C and existing tracing implementations like DTrace. bpftrace uses LLVM as a backend to compile scripts to eBPF bytecode.
Installing bpftrace
bpftrace can be installed as a yum package (or equivalent for your operating system).
> sudo yum install bpftrace
Once installed, you can begin executing bpftrace scripts. For example,
the following example attaches an eBPF probe to the sys_enter_open
system call that is executed when a file is opened. The output of that
command is passed to the awk-like function to print the command that was
executed when sys_enter_open was called, along with the filename that
was opened.
> sudo bpftrace -e 'tracepoint:syscalls:sys_enter_open { printf("%s %s\n", comm, str(args->filename)); }'
Attaching 1 probe...
pickup maildrop
date /usr/lib/locale/locale-archive
date /etc/localtime
pidof .
bpftrace Tools
Like BCC, bpftrace comes with a number of existing tools for tracing the environment. These are available in the Github repo under the tools directory and include thigns like seeing which processes are getting killed because they are out of memory, or showing block I/O latency as a histogram.
In a standard installation, bpftrace tools are installed to the
/usr/share/bpftrace/tool directory and can be executed as the root
user. For example, you can execute the cpuwalk.bt program to sample
which CPUs are being used to execute processes. Executing this script
will attach the required probes to the kernel, and wait while collecting
data. After waiting for a time period for data to be collected, you can
kill the process using Ctrl-C to view the results. On my machine, this
shows that all CPUs are being used.
> /usr/share/bpftrace/tools $ sudo ./cpuwalk.bt
Attaching 2 probes...
Sampling CPU at 99hz... Hit Ctrl-C to end.
^C

@cpu:
[0, 1)                 6 |@@@@@@@@@@@@@@@@@@@@@@@@@@@@@@@@@@@@@@@@@@@@        |
[1, 2)                 7 |@@@@@@@@@@@@@@@@@@@@@@@@@@@@@@@@@@@@@@@@@@@@@@@@@@@@|
[2, 3)                 5 |@@@@@@@@@@@@@@@@@@@@@@@@@@@@@@@@@@@@@               |
[3, 4)                 4 |@@@@@@@@@@@@@@@@@@@@@@@@@@@@@                       |
[4, 5)                 3 |@@@@@@@@@@@@@@@@@@@@@@                              |
[5, 6)                 2 |@@@@@@@@@@@@@@                                      |
[6, 7)                 1 |@@@@@@@                                             |
[7, 8)                 5 |@@@@@@@@@@@@@@@@@@@@@@@@@@@@@@@@@@@@@               |
Contrast this with the following example. In this case, only a single CPU is doing work. If the workload assigned to this CPU was supposed to make use of multiple CPUs, it is not working properly and should be investigated.
> /usr/share/bpftrace/tools $ sudo ./cpuwalk.bt
Attaching 2 probes...
Sampling CPU at 99hz... Hit Ctrl-C to end.
^C

@cpu:
[0, 1)                 243 |@@@@@@@@@@@@@@@@@@@@@@@@@@@@@@@@@@@@@@@@@@@@        |
[1, 2)                 0   |                                                    |
[2, 3)                 0   |                                                    |
[3, 4)                 0   |                                                    |
[4, 5)                 0   |                                                    |
[5, 6)                 0   |                                                    |
[6, 7)                 0   |                                                    |
[7, 8)                 0   |                                                    |
In contrast with BCC, bpftrace programs are written usign a high-level
scripting language. The entirety of the cpuwalk program is just
a handful of lines specifying what to execute out of the existing
commands available in the bpftrace
language.
BEGIN
{
	printf("Sampling CPU at 99hz... Hit Ctrl-C to end.\n");
}

profile:hz:99
/pid/
{
	@cpu = lhist(cpu, 0, 1000, 1);
}
Writing your own eBPF programs using bpftrace
The -e 'program' option to bpftrace allows you to execute arbitrary
programs as one-liners. For example, you can execute a simple “Hello,
World!” program using the following one-liner:
> sudo bpftrace -e 'BEGIN { printf("Hello, World!\n"); }'
Attaching 1 probe...
Hello, World!
^C
The BEGIN block is a special probe that fires at the beginning of the
program. It can be used to print header information or set any variables.
You can execute a trace by calling the probe, and passing the resulting
data to a print command. For example, this one-liner calls the
tracepoint:syscalls:sys_enter_openat probe, and then calls a print
function with the results.
> sudo bpftrace -e 'tracepoint:syscalls:sys_enter_openat { printf("%s %s\n", comm, str(args.filename)); }'
Attaching 1 probe...
snmp-pass /proc/cpuinfo
snmp-pass /proc/stat
snmpd /proc/net/dev
snmpd /proc/net/if_inet6
^C
Two things to note. First, comm is the name of a special builtin
variable that has the current process’s name. Second, args is
a structure containing tracepoint arguments. You can list tracepoint
arguments using the -vl option, like this:
> sudo bpftrace -lv 'tracepoint:syscalls:sys_enter_openat'
tracepoint:syscalls:sys_enter_openat
    int __syscall_nr
    int dfd
    const char * filename
    int flags
    umode_t mode
The output shows that there is a filename argument, which we reference in our script to display the filename passed into the probe.
You can list more probes using the -l command. For example, the
following command lists all probes that begin with sys_enter_:
> sudo bpftrace -l 'tracepoint:syscalls:sys_enter_*'
You can use map data structures to store data gathered during bpftrace
execution using the @ syntax. The following example creates a map using
@, specifies the key to the map as comm (the builtin for the current
process), and the builtin count() function that counts the number of
times it was called. Putting this together, the following script attaches
a probe to the sys_enter call and counts the number of times it was
called per process. This gives us the total number of system calls by
process name.
bpftrace -e 'tracepoint:raw_syscalls:sys_enter { @[comm] = count(); }'
Attaching 1 probe...
^C

@[bpftrace]: 6
@[systemd]: 24
@[snmp-pass]: 96
@[sshd]: 125
bpftrace Reference Material
By examining the existing tools available in the bpftrace source code, you can get a sense of how eBPF programs are written and integrated with Python code. To dive deeper, there are two main resources you can leverage:
- bpftrace One-Liner Tutorial
- This tutorial develops a progressively deeper understanding of how to execute bpftrace programs in the form of simple one-liners.
- bpftrace Reference Guide
- This reference guide provides documentation for how to run the bpftrace command, and the bpftrace language itself. Use this to understand how to write and execute more complex bpftrace programs.
ebpf-go - the eBPF Library for Go
The eBPF library for Go fills a similar niche as BCC — allowing you to read, modify and load eBPF programs and attach them to various hooks in the Linux kernel. A distinguishing feature of the eBPF library for Go is that it is a pure Go implementation that compiles an eBPF program to bytecode and contains an object loader that embeds that bytecode alongside the Go code. This makes it possible to compile a single Go binary that using the library, and have that execute on a variety of architectures without invoking external dependencies.
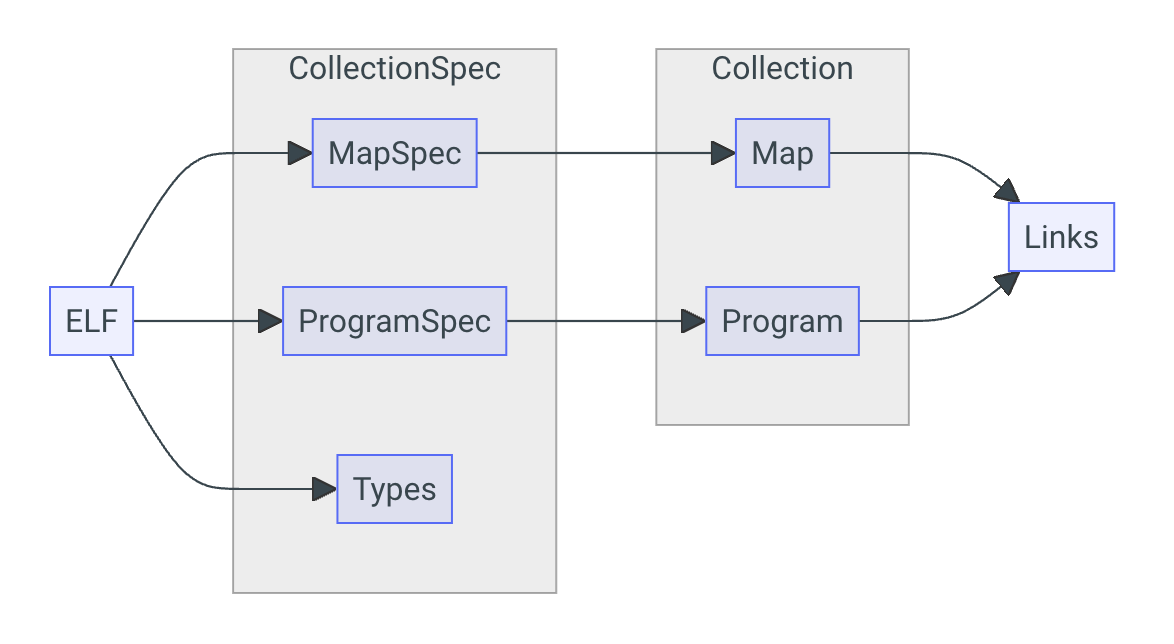
In the diagram below, an eBPF program is compiled into an Executable and Linkable Format (ELF). This ELF format provides the basic program specifcation, any maps used to share data between the kernel and userspace, and type information. Once the spec for the program is loaded, it can be instantiated into the kernel as an ePBF program using the go library.
As a more concrete example, the C code listed below defines a simple Map with a key and value, and declares an eBPF program that can be attached to socket system calls. The actual program doesn’t do anything, but serves as a demonstration.
#include <linux/bpf.h>
#include <bpf/bpf_helpers.h>

// Declare a hash map called 'my_map' with a u32 key and a u64 value.
// The __uint, __type and SEC macros are from libbpf's bpf_helpers.h.
struct {
    __uint(type, BPF_MAP_TYPE_HASH);
    __type(key, __u32);
    __type(value, __u64);
    __uint(max_entries, 1);
} my_map SEC(".maps");

// Declare a dummy socket program called 'my_prog'.
SEC("socket") int my_prog() {
    return 0;
}
The SEC() macro used in the eBPF C code sends a hint to the compiler to
place a symbol (a variable or function) in a specific section of the
resulting eBPF object binary that we can use to load the associated
objects in Go code. This follows Linux convention where program binaries
are divided into so-called ‘sections’. All sections have names, many of
which are assigned special meaning. For example, .text is where program
text (executable instructions) goes by default.
After compiling this code into ELF format, the corresponding Go code
contains facilities to load the program into a CollectionSpec, and read
the MapSpec and ProgramSpec. Then we can load it into the kernel as
a NewCollection.
// Parse an ELF into a CollectionSpec.
// bpf_prog.o is the result of compiling BPF C code.
spec, err := ebpf.LoadCollectionSpec("bpf_prog.o")
if err != nil {
    panic(err)
}

// Look up the MapSpec and ProgramSpec in the CollectionSpec.
m := spec.Maps["my_map"]
p := spec.Programs["my_prog"]

// Instantiate a Collection from a CollectionSpec to load it into the
// kernel.
coll, err := ebpf.NewCollection(spec)
Installing the eBPF library for Go
The library for go is distributed as a standalone go library. As such, it
can be integrated with a go program in an idiomatic way using the go
toolchain. If you have an existing go module, you can add a dependency on
the eBPF go library using go get github.com/cilium/ebpf.
The ebpf-go package uses LLVM for compiling an ePBF program into bytecode. We also need the libbpf and kernel headers to access some of the helper function and macros for writing eBPF. I installed LLVM and the headers on my test Amazon Linux 2 machine using the following command:
> sudo yum -y install llvm.x86_64 libbpf-devel kernel-devel
eBPF Examples
A number of examples of eBPF programs are available in the Github repo for the Go library. Because the library is more suited towards integrating ePBF into Go applications, these examples are not executable tools you can use for analysis like BCC and bpftrace. Instead, they show you how to write an eBPF program that can be compiled into bytecode and how to interact with that code from a Go program.
Writing an eBPF program using ebpf-go
Writing an eBPF program using the ebpf-go toolchain requires writing ePBF code directly using eBPFs c-like language. The following example program counts the number of packets that reach a network interface.
//go:build ignore
// The ignore build tag exludes this C file from the Go compiler toolchain

// These header files include macros for eBPF types and function
#include <linux/bpf.h>
#include <bpf/bpf_helpers.h>

// structs defined with the `SEC(".maps") macro compiles the data
// structure into a eBPF map that is shared at a location where epbf-go
// can load it
struct {
    __uint(type, BPF_MAP_TYPE_ARRAY);
    __type(key, __u32);
    __type(value, __u64);
    __uint(max_entries, 1);
} pkt_count SEC(".maps");

// count_packets atomically increases a packet counter on every invocation.
SEC("xdp")
int count_packets() {
    __u32 key    = 0;
    __u64 *count = bpf_map_lookup_elem(&pkt_count, &key);
    if (count) {
        __sync_fetch_and_add(count, 1);
    }

    return XDP_PASS;
}
To compile this code, we create a helper file that epbf-go will use to
compile the C code into an object file using the Go toolchain. Go ahead
and create the file gen.go:
package main

//go:generate go run github.com/cilium/ebpf/cmd/bpf2go counter counter.c
And use the go generate command to run the compiler:
> go generate
This command creates object files called counter_bpfel.o and
counter_bpfeb.o containing the compiled eBPF byte code, alongside two
go files called counter_bpfel.go and counter_bpfeb.go containing code
for interacting with the ePBF program from a Go program. The files ending
with el.o and el.go are for little-endian architectures like amd64 or
arm64, whereas the files ending with eb.o and eb.go are for
big-endian architectures.
If you examine the Go program, you will see lines like the following:
//go:embed counter_bpfel.o
var _CounterBytes []byte
The call to //go:embed reads the contents of the compiled object file
into a Go slice of bytes at compile time. The result is that the compiled
Go binary includes the embedded byte code. As a consequence, the
standalone Go binary is all that needs to be deployed to run your eBPF
program on a target machine.
Finally, you can integrate the compiled eBPF C code and Go helper
functions with a Go program using the eBPF library. The following code
loads the compiled eBPF C code into the userspace program using
loadCounterObjects, and attaches the program to the kernel using
link.AttachXDP. The remainder of the program interfaces with the eBPF
program through the objs variable. For example, the line
objs.PktCount.Lookup(uint32(0), &count) reads the pkt_count data from
the executing eBPF program.
package main

import (
    "log"
    "net"
    "os"
    "os/signal"
    "time"

    "github.com/cilium/ebpf/link"
)

func main() {
    // Load the compiled eBPF ELF and load it into the kernel.
    var objs counterObjects
    if err := loadCounterObjects(&objs, nil); err != nil {
        log.Fatal("Loading eBPF objects:", err)
    }
    defer objs.Close()

    ifname := "eth0" // Change this to an interface on your machine.
    iface, err := net.InterfaceByName(ifname)
    if err != nil {
        log.Fatalf("Getting interface %s: %s", ifname, err)
    }

    // Attach count_packets to the network interface.
    link, err := link.AttachXDP(link.XDPOptions{
        Program:   objs.CountPackets,
        Interface: iface.Index,
    })
    if err != nil {
        log.Fatal("Attaching XDP:", err)
    }
    defer link.Close()

    log.Printf("Counting incoming packets on %s..", ifname)

    // Periodically fetch the packet counter from PktCount,
    // exit the program when interrupted.
    tick := time.Tick(time.Second)
    stop := make(chan os.Signal, 5)
    signal.Notify(stop, os.Interrupt)
    for {
        select {
        case <-tick:
            var count uint64
            err := objs.PktCount.Lookup(uint32(0), &count)
            if err != nil {
                log.Fatal("Map lookup:", err)
            }
            log.Printf("Received %d packets", count)
        case <-stop:
            log.Print("Received signal, exiting..")
            return
        }
    }
}
You can build and run this program using the typical Go toolchain to see packet counts for the interface you configured:
go build && sudo ./ebpf-test
epbf-go Reference Material
The best reference for epbf-go is the official documentation, and the Github repo with examples.
libbpf and BPF CORE
Finally we come to libbpf. The libbpf library is a C/C++-based that
abstracts the BPF system calls with library APIs for applications.
Historically, BCC was the framework of choice when you had to develop a BPF application that integrated with the kernel. BCC brings the entire LLVM/Clang library in and embeds it inside itself, allowing BCC to tailor compilation of your ePBF program to a specific target kernel on the host. Because both eBPF and the kernel are changing frequently, a tool like BCC was typically the only way to develop a maintainable BPF application.
In the last few years, this has changed with the advent of BPF Core, which stands for Compile Once - Run Everywhere.
Writing a libbpf program
The simplest way to get started writing a libbpf program is using the libbpf-bootstrap to scaffold a minimal libbpf development environment you can work from. This project contains a few example eBPF programs, including a minimal working example, and ones that use existing tracepoints or kprobes. Some examples are available in both C and Rust. These should give you a starting point for writing your own.
Getting started with libbpf-bootstrap requires installing the required
dependencies and cloning the repo, making sure to include submodules.
> sudo yum install -y clang elfutils-libelf elfutils-libelf-devel zlib-devel
> git clone --recurse-submodules https://github.com/libbpf/libbpf-bootstrap
> cd examples/c
> make minimal
Like the other tools discussed, libbpf consists of an eBPF program
coupled with a userspace program — this time written in C. If you examine
the minimal.c file, you can see a key lines of code that open the eBPF
application, load it into the kernel (which runs the verifier), and then
attaches the program to a tracepoint.
/* Open BPF application */
skel = minimal_bpf__open();
if (!skel) {
    fprintf(stderr, "Failed to open BPF skeleton\n");
    return 1;
}

...

/* Load & verify BPF programs */
err = minimal_bpf__load(skel);
if (err) {
    fprintf(stderr, "Failed to load and verify BPF skeleton\n");
    goto cleanup;
}

...

/* Attach tracepoint handler */
err = minimal_bpf__attach(skel);
if (err) {
    fprintf(stderr, "Failed to attach BPF skeleton\n");
    goto cleanup;
}
The minimal_bpf_* functions are generated in the Makefile using the
bfptool gen command, generates a skeleton header file that reflects
the structure of the ePBF program by out any available maps, program, or
variables. If loading the skeleton succeeds, the return value is
populated with valid data types representing the eBPF program.
libbpf Reference Material
Reference material for libbpf is spread throughout the Linux kernel,
and the library code.
- Linux BPF documentation
- libbpf API documentation
- Example applications:
This blog post provided an introduction to the eBPF developer ecosystem for anyone interested in writing their own eBPF programs. Although there is overlap between the tools, they each end up satisfying their own unique use cases.
First, if you are interested in using eBPF as an analysis and tracing
tool, look to bpftrace which provides a simple awk-like language for
running eBPF programs as simple scripts.
If you are writing your own eBPF programs, or integrating eBPF in
a larger project, consider ebpf-go or libbpf. Both provide similar
facilities for compiling eBPF and loading the compiled object into
a userspace program, and the choice largely comes down to which
programming language you prefer or are integrating with. Of these two
tools, libbpf is typically the most up-to-date with the latest
developments in eBPF and more closely follows, advancements made in the
Linux kernel that may not be made available in tools like bpftrace for
a longer period of time. epbf-go is a good choice when
you are writing the user space portion of the application in Go. This
makes sense if you are working with the Kubernetes ecosystem, as an
example.
There is a lot of documentation available for the BPF subsystem and supporting libraries, but it is spread across various different locations. Unfortunately, there is no single definitive guide to BPF and there is still a lot of unwritten knowledge, though some of the resources provided in this article may help you get started on your own journey.