Shortly after deploying a new Kubernetes cluster, one of the first things you will likely want to do is collect some metrics and data about how it operates. There are two projects that are typically used for this, and since they are named similarly it can be confusing to know which one you should use and why.
This post hopes to clear up any confusion between the Kubernetes Metrics Server and kube-state-metrics.
Kubernetes Metrics Server
Likely the first project you will encounter when diving into Kubernetes metrics and monitoring is the Kubernetes Metrics Server.
The Metrics API offers a basic set of metrics to support automatic scaling. This API makes information available about CPU and memory usage for each node and pod in the cluster. If you deploy the Metrics API into your cluster, clients of the Kubernetes API can then query for this information.
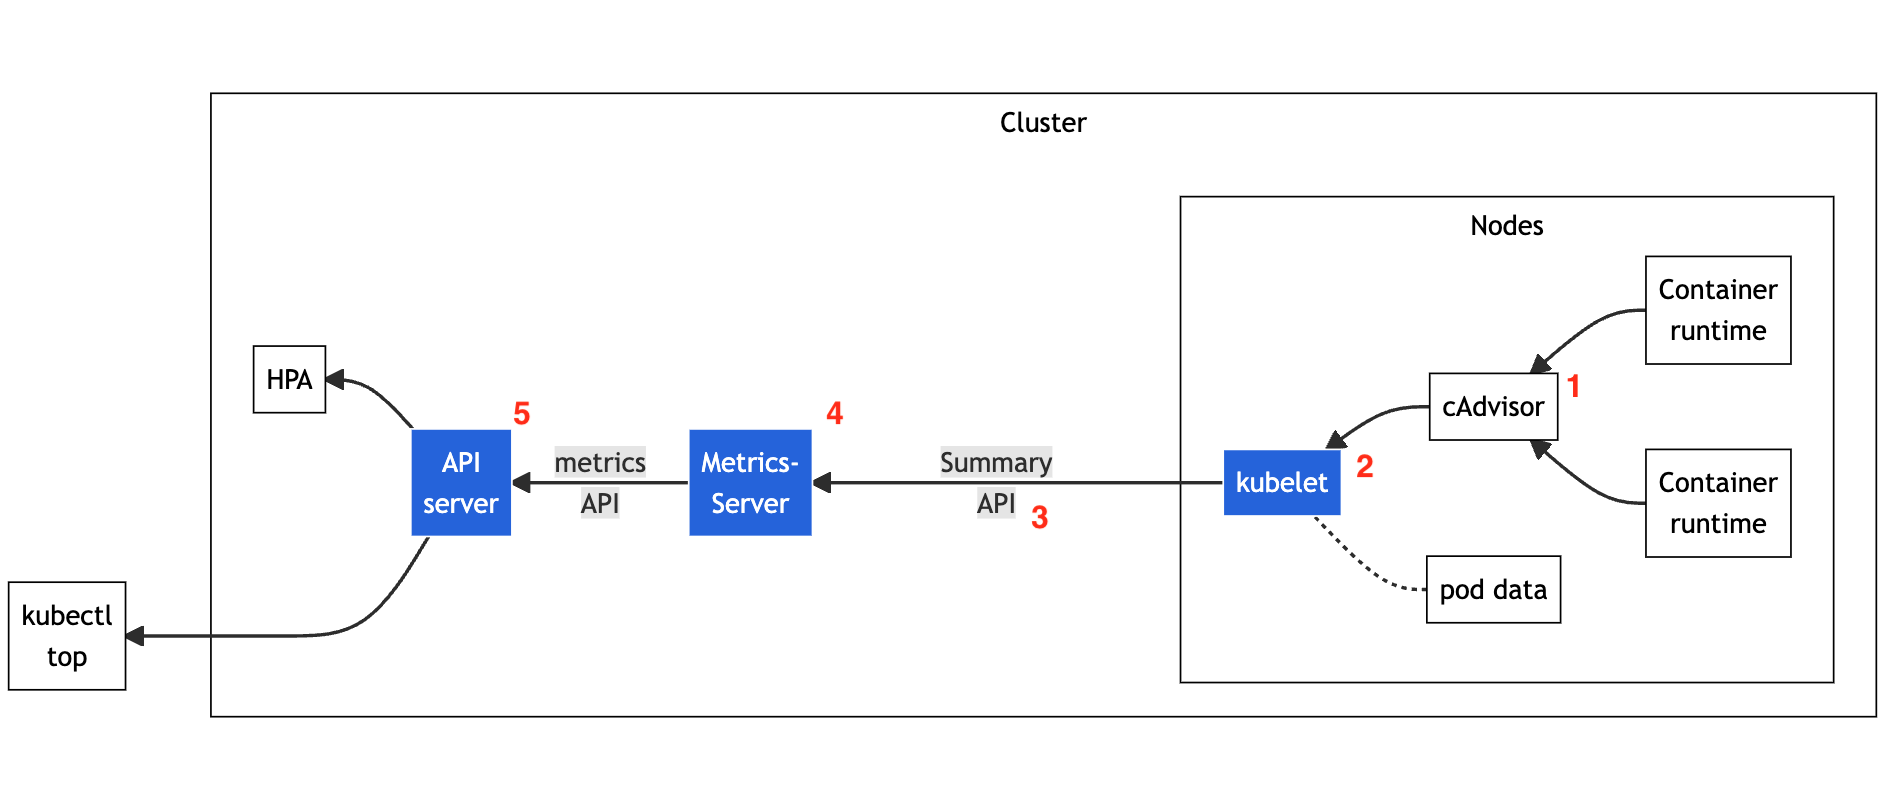
The Metrics API gets its data from the metrics pipeline. Depicted
below, the metrics pipeline consists of (1) the cAdvisor daemon that
collects, aggregates, and exposes container metrics. kubelet (2) is
a node agent responsible for managing container resources. It gathers
data from cAdvisor and from individual resource metrics that it
monitors for each pod. kubelet exposes a summary of pod and node
statistics through its summary API (3). metrics-server (4) is a cluster
component that collects and aggregates resource metrics pulled from each
kubelet. Lastly, the API server (5) serves Metrics API for use by
horizontal or vertical pod autoscaler, and by the kubectl top command.
Metrics Server is a reference implementation of the Metrics API, but that
API can be implemented by alternative monitoring solutions.
For example, you can query for the metrics from a single node in your
cluster using the nodes endpoint.
❯ kubectl get --raw "/apis/metrics.k8s.io/v1beta1/nodes/<the-name-of-your-node>" | jq '.'
The returned value includes CPU and memory usage under the usage key.
{
  "kind": "NodeMetrics",
  "apiVersion": "metrics.k8s.io/v1beta1",
  "metadata": {
    "name": "<your node name>",
    "creationTimestamp": "2023-03-23T13:43:15Z",
  },
  "timestamp": "2023-03-23T13:43:07Z",
  "window": "20.041s",
  "usage": {
    "cpu": "2080431970n",
    "memory": "3378708Ki"
  }
}
To view individual pod metrics, use the pods endpoint with the correct namespace.
kubectl get --raw "/apis/metrics.k8s.io/v1beta1/namespaces/default/pods/<your-pod-name>'.'
{
  "kind": "PodMetrics",
  "apiVersion": "metrics.k8s.io/v1beta1",
  "metadata": {
    "name": "<your-pod-name>",
    "namespace": "default",
    "creationTimestamp": "2023-03-23T13:50:25Z",
  },
  "timestamp": "2023-03-23T13:50:13Z",
  "window": "15.314s",
  "containers": [
    {
      "name": "opentelemetry-collector",
      "usage": {
        "cpu": "7120567n",
        "memory": "571084Ki"
      }
    }
  ]
}
A complete set of metric data is available through the kubectl top
command. You can view node metrics with kubectl top node and pod
metrics with kubectl top pod:
$ kubectl top node

NAME                 CPU(cores)   CPU%   MEMORY(bytes)   MEMORY%
kind-control-plane   338m         4%     1662Mi          10%
The output from kubectl top node gives you information about CPU
(cores), CPU percentage, memory, and memory percentage. Values are given
in using standard metric units
Let’s see what these terms mean:
- CPU(cores)
- The unit
min this measure means millicpu, or one thousandth of a CPU unit. 1000m is equal to 1 CPU, so in this example 338m means 33.8% of 1 CPU.
- The unit
- CPU%
- CPU percentage stands for the total CPU usage for the entire node.
In this case, the
kind-control-planenode is using 4% of its CPU.
- CPU percentage stands for the total CPU usage for the entire node.
In this case, the
- Memory(bytes)
- Memory displays the total amount of bytes in use. The unit
Mirefers to mebibytes. Typically, the unitMis mega which stands for one million. However, since bits and bytes are typically delineated in powers of two, the unitMiis used to signify the explicit value1,048,576. Usually we just refer to this as megabytes. In our example, 1662 megabytes are in use.
- Memory displays the total amount of bytes in use. The unit
- Memory%
- Memory percentage stands for the total memory usage for the entire node. Here we are using 10% of available memory on the node
The kubectl top pod command provides similar statistics, at the pod
level. However, total percentages are dropped.
$ kubectl top pod

NAME                     CPU(Cores)   MEMORY(Bytes)
nginx-653c7b42sd-7c9ae   3m           1Mi
The top pod command uses the currently configured namespace, but you
can also filter by namespace with the --namespace option like kubectl top pod --namespace system or list pods from all namespaces with
kubectl top pod --all-namespaces.
The Metrics API only offers the minimum CPU and memory metrics to enable automatic scaling using horizontal pod autoscaling and / or vertical pod autoscaling. It is not a complete monitoring solution, and should not be used if you need accurate usage metrics or more complete monitoring.
kube-state-metrics
kube-state-metrics (KSM) is a simple service that listens to the Kubernetes API server and generates metrics about the state of the objects deployed in the cluster. You can use KSM to view metrics on deployments, nodes, pods, and more. KSM holds an entire snapshot of Kubernetes state in memory and continuously generates new metrics based off of it.
The metrics generated by kube-state-metrics are generated from the
Kubernetes API objects without any modification. This ensures that any
metrics have the same grade of stability as the Kubernetes API objects
themselves. This also means that in certain situations,
kube-state-metrics may not show the exact same values as kubectl,
which uses heuristics to generate displayed values. In these cases,
consider kube-state-metrics to be the accurate data source.
kube-state-metrics gathers data using the standard Kubernetes go client
and Kubernetes API. This raw data is used to create snapshot of the state
of the objects in Kubernetes cluster.

When deployed, kube-state-metrics exposes an API at the /metrics
endpoint using the 8080 port that can be used to retrieve the state
snapshot. If we install kube-state-metrics and expose the port, we are
able to poll the metrics endpoint to get a list of metrics that
kube-state-metrics tracks.
For example, if you deployed KSM to the kube-system namespace, you can
expose it at the port 30135 (as an example).
❯ kubectl port-forward svc/kube-state-metrics 30135:8080 -n kube-system
Navigating to http://localhost:30135/metrics will list all the metrics
tracked by the KSM deployment. However, the information displayed is not
very consumable — it is exhaustive over all objects in the cluster, and
in a raw format. The metrics exposed are in Prometheus’ native format,
and Prometheus can be configured to scrape the /metrics endpoint and
store it in its internal time-series database for analysis.
Differences between Metrics Server and kube-state-metrics
Although the Metrics Server seems similar to kube-state-metrics, they
are meant for different purposes that are summarized in this table:
| Metrics Server | kube-state-metrics |
|---|---|
| Shows resource utilization of objects (CPU/memory) | Shows state of objects (up/available/deleted etc.) |
| Applies heuristics for easier understanding | Displays raw data from Kubernetes API |
| Serves data in the Metrics API format | Serves data in Prometheus format |